CakePHP Rhythm Plugin
Real-time application performance monitoring for CakePHP 5.x applications with comprehensive metric collection, storage, and visualization.
Features
Core Monitoring
- Server Performance Monitoring - CPU, memory, disk usage, and system metrics
- HTTP Request Tracking - Response times, status codes, and user request patterns
- Database Query Performance - Slow query detection with configurable thresholds
- Queue System Monitoring - Job processing, queue statistics, and performance metrics
- Exception Tracking - Application exception monitoring and reporting
- Outgoing Request Monitoring - External API calls and HTTP client performance
- Cache Performance - Cache hit rates and performance metrics
- Job Performance - Background job execution times and statistics
Advanced Features
- Multi-Server Support - Monitor multiple servers with unified dashboard
- Configurable Sampling - Adjustable sampling rates for different metric types
- Grouping System - Automatic grouping of similar metrics to reduce cardinality
- Real-time Dashboard - Live performance monitoring with interactive widgets
- Flexible Storage - Database and Redis storage options with automatic aggregation
- Event System - CakePHP event integration for custom metric recording
- Command Line Tools - CLI commands for metric processing and server monitoring
Installation
- Install the plugin via Composer:
composer require skie/rhythm- Load the plugin in your
Application.php:
public function bootstrap(): void
{
    parent::bootstrap();

    $this->addPlugin('Rhythm', ['bootstrap' => true, 'routes' => true]);
}- Run the database migrations:
bin/cake migrations migrate -p Rhythm- Database Configuration
NOTE
Rhythm's storage implementation currently requires a MySQL, MariaDB, PostgreSQL. It is important to note that quoteIdentifiers should be set to true in your database configuration for Rhythm to work properly.
By default, Rhythm.storage.database.connection is set to 'default' in the database configuration but you can change it to your own database connection.
Configuration
The plugin can be configured via the config/rhythm.php file:
return [
    'Rhythm' => [
        'enabled' => env('RHYTHM_ENABLED', true),

        'storage' => [
            'driver' => env('RHYTHM_STORAGE_DRIVER', 'database'),
            'database' => [
                'connection' => 'default',
                'tables' => [
                    'entries' => 'rhythm_entries',
                    'aggregates' => 'rhythm_aggregates',
                ],
            ],
            'cache' => [
                'config' => 'default',
                'prefix' => 'rhythm:',
            ],
        ],

        'ingest' => [
            'driver' => env('RHYTHM_INGEST_DRIVER', 'redis'),
            'redis' => [
                'host' => env('REDIS_HOST', '127.0.0.1'),
                'port' => env('REDIS_PORT', 6379),
                'password' => env('REDIS_PASSWORD', null),
                'database' => env('REDIS_DATABASE', 0),
                'queue_key' => 'rhythm:metrics:queue',
                'processing_key' => 'rhythm:metrics:processing',
                'control_channel' => 'rhythm:control',
                'max_items_per_digest' => 100,
                'trim' => [
                    'keep' => '1 hour',
                ],
            ],
        ],

        'recorders' => [
            'servers' => [
                'className' => \Rhythm\Recorder\ServersRecorder::class,
                'enabled' => env('RHYTHM_SERVER_ENABLED', true),
                'server_name' => env('RHYTHM_SERVER_NAME', gethostname()),
                'directories' => explode(':', env('RHYTHM_SERVER_DIRECTORIES', '/')),
                'ignore' => [
                    '/^\/tmp/',
                    '/^\/var\/log/',
                    '/^\/proc/',
                    '/^\/sys/',
                ],
            ],
            'user_requests' => [
                'className' => \Rhythm\Recorder\UserRequestsRecorder::class,
                'enabled' => env('RHYTHM_USER_REQUESTS_ENABLED', true),
                'sample_rate' => env('RHYTHM_USER_REQUESTS_SAMPLE_RATE', 1.0),
                'ignore' => [
                    '#^/rhythm#',
                    '#^/health#',
                ],
            ],
            'slow_queries' => [
                'className' => \Rhythm\Recorder\SlowQueriesRecorder::class,
                'enabled' => env('RHYTHM_SLOW_QUERIES_ENABLED', true),
                'threshold' => env('RHYTHM_SLOW_QUERIES_THRESHOLD', 1000),
                'sample_rate' => env('RHYTHM_SLOW_QUERIES_SAMPLE_RATE', 0.1),
            ],
            'exceptions' => [
                'className' => \Rhythm\Recorder\ExceptionsRecorder::class,
                'enabled' => env('RHYTHM_EXCEPTIONS_ENABLED', true),
                'sample_rate' => env('RHYTHM_EXCEPTIONS_SAMPLE_RATE', 1.0),
            ],
            'queues' => [
                'className' => \Rhythm\Recorder\QueuesRecorder::class,
                'enabled' => env('RHYTHM_QUEUES_ENABLED', true),
                'sample_rate' => env('RHYTHM_QUEUES_SAMPLE_RATE', 1.0),
            ],
            'slow_jobs' => [
                'className' => \Rhythm\Recorder\SlowJobsRecorder::class,
                'enabled' => env('RHYTHM_SLOW_JOBS_ENABLED', true),
                'threshold' => env('RHYTHM_SLOW_JOBS_THRESHOLD', 5000),
                'sample_rate' => env('RHYTHM_SLOW_JOBS_SAMPLE_RATE', 0.1),
            ],
            'slow_requests' => [
                'className' => \Rhythm\Recorder\SlowRequestsRecorder::class,
                'enabled' => env('RHYTHM_SLOW_REQUESTS_ENABLED', true),
                'threshold' => env('RHYTHM_SLOW_REQUESTS_THRESHOLD', 2000),
                'sample_rate' => env('RHYTHM_SLOW_REQUESTS_SAMPLE_RATE', 0.1),
            ],
            'outgoing_requests' => [
                'className' => \Rhythm\Recorder\OutgoingRequestRecorder::class,
                'enabled' => env('RHYTHM_OUTGOING_REQUESTS_ENABLED', true),
                'threshold' => env('RHYTHM_OUTGOING_REQUESTS_THRESHOLD', 1000),
                'sample_rate' => env('RHYTHM_OUTGOING_REQUESTS_SAMPLE_RATE', 0.1),
                'groups' => [
                    '#^https?://api\.([^/]+)\.com/([^/]+)/(\d+)#' => 'https://api.*.com/*/*',
                    '#^https?://([^/]+)\.api\.([^/]+)\.com/([^/]+)#' => 'https://*.api.*.com/*',
                    '#^https?://([^/]+)\.com/api/v(\d+)/([^/]+)#' => 'https://*.com/api/v*/*',
                    '#^https?://([^/]+)\.com/([^/]+)/(\d+)#' => 'https://*.com/*/*',
                ],
            ],
        ],

        'buffer' => env('RHYTHM_BUFFER', 5000),
        'trim' => [
            'keep' => env('RHYTHM_TRIM_KEEP', '24 hours'),
        ],
    ],
];Environment Variables
Set these environment variables to configure Rhythm:
# Enable Rhythm
RHYTHM_ENABLED=true

# Storage configuration
RHYTHM_STORAGE_DRIVER=database

# Ingest configuration
RHYTHM_INGEST_DRIVER=redis

# Redis configuration (if using Redis ingest)
REDIS_HOST=127.0.0.1
REDIS_PORT=6379
REDIS_PASSWORD=your_password
REDIS_DATABASE=0

# Recorder configuration
RHYTHM_SERVER_ENABLED=true
RHYTHM_USER_REQUESTS_ENABLED=true
RHYTHM_SLOW_QUERIES_ENABLED=true
RHYTHM_EXCEPTIONS_ENABLED=true
RHYTHM_QUEUES_ENABLED=true
RHYTHM_SLOW_JOBS_ENABLED=true
RHYTHM_SLOW_REQUESTS_ENABLED=true
RHYTHM_OUTGOING_REQUESTS_ENABLED=trueUsage
Data Flow Architecture
Rhythm uses a two-phase approach for efficient metric collection:
- Ingest Phase: Metrics are collected in memory during requests and stored in a persistent queue
- Digest Phase: Queued metrics are processed into final storage with automatic aggregation
This approach solves PHP's "run and die" problem by persisting metrics between requests.
Automatic Monitoring
The plugin automatically monitors:
- Server performance metrics (CPU, memory, disk)
- HTTP requests and response times
- Database query performance
- Application exceptions
- Queue system performance
- Background job execution
- Outgoing HTTP requests
- Cache performance
Manual Metric Recording
You can also record custom metrics:
// In a controller or service
$rhythm = $this->getContainer()->get(\Rhythm\Rhythm::class);

// Record a simple metric
$rhythm->record('custom_metric', 'user_action', 150);

// Set a metric value
$rhythm->set('config_value', 'cache_hit_rate', '85.5');

// Record with aggregations
$rhythm->record('performance', 'api_call', 250)
    ->count()
    ->avg()
->max();Processing Metrics
Metrics are automatically ingested when the buffer is full. To process queued metrics:
Redis Ingest (Default)
# Process metrics from Redis queue
bin/cake rhythm digestNull Ingest (Testing/Development)
The Null Ingest driver discards all metrics, useful for:
- Testing environments where you don't want metric overhead
- Temporarily disabling metrics without changing configuration
- Development when you want zero metric collection
// In config/rhythm.php
'ingest' => [
    'driver' => 'null', // Discard all metrics
],No additional commands needed - all metrics are silently discarded.
Recommended: Set up a cron job to run digest periodically:
# Every 5 minutes
*/5 * * * * cd /path/to/your/app && bin/cake rhythm digestServer Monitoring
Monitor server performance with the check command:
# Take a single server snapshot
bin/cake rhythm check --once

# Monitor continuously with 5-second intervals
bin/cake rhythm check --interval=5Dashboard Access
Access the Rhythm dashboard at /rhythm/dashboard to view: Server state and performance metrics
- Queue activity and statistics
- Slow queries and requests
- Exception tracking
- Cache performance
- Outgoing request monitoring
- Job performance metrics
Available Recorders
ServersRecorder
Monitors server performance metrics including CPU, memory, and disk usage.
UserRequestsRecorder
Tracks HTTP requests, response times, and user request patterns.
SlowQueriesRecorder
Monitors database query performance and identifies slow queries.
ExceptionsRecorder
Tracks application exceptions for debugging and monitoring.
QueuesRecorder
Monitors queue system performance and job processing statistics.
SlowJobsRecorder
Tracks background job execution times and identifies slow jobs.
SlowRequestsRecorder
Identifies slow HTTP requests based on configurable thresholds.
OutgoingRequestRecorder
Monitors external API calls and HTTP client performance with automatic URI grouping.
GitRecorder
Captures Git repository information including current branch, recent commits, and repository status. Automatically detects Git repositories and provides commit classification and metadata tracking.
Available Widgets
ServerStateWidget

Shows real-time server performance with CPU, memory, and disk usage. Displays sparkline charts and status indicators for each server. Shows online/offline status.
QueuesWidget
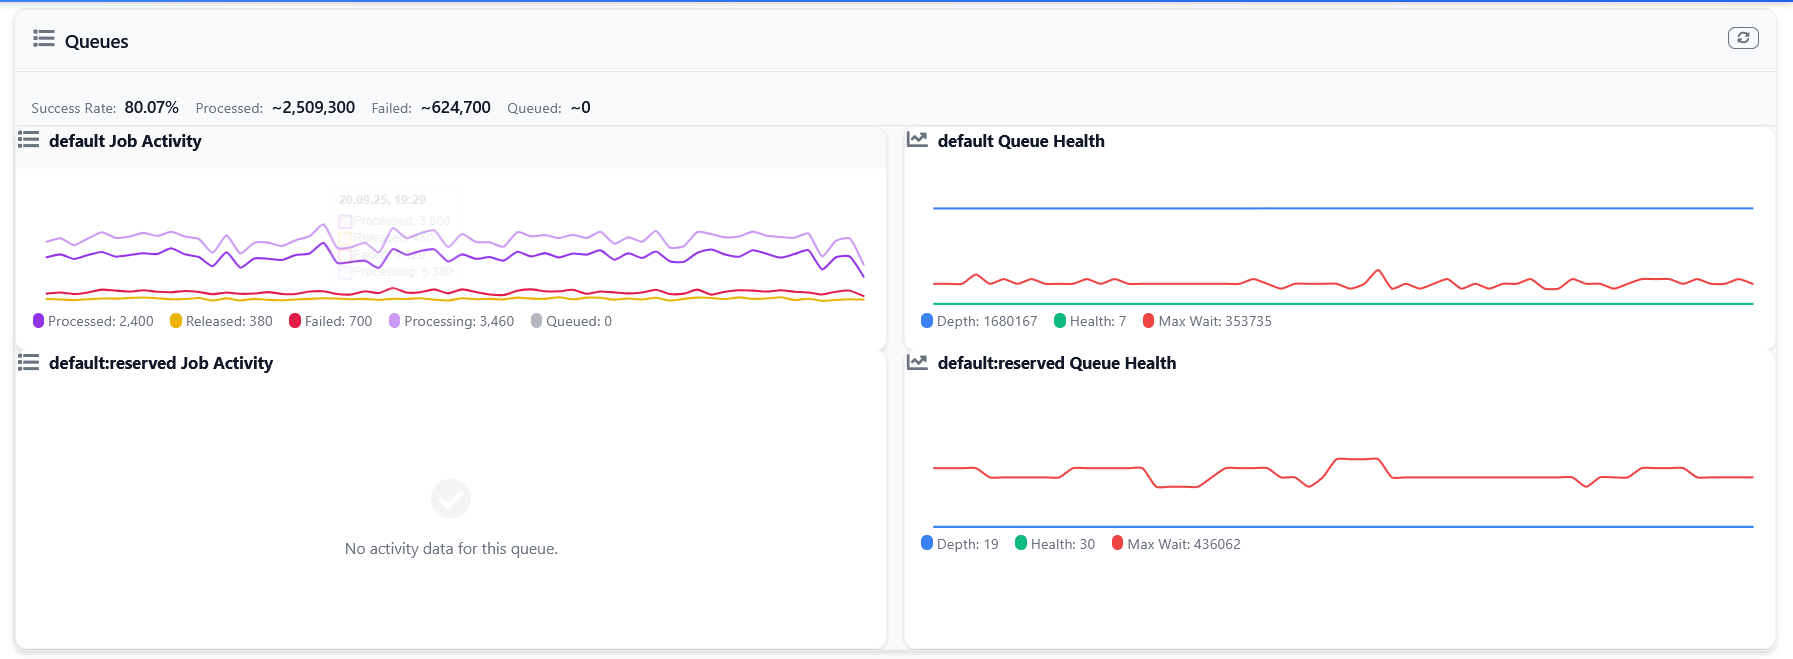
Shows job queues with charts showing job states (queued, processing, processed, failed). Shows queue depth, health, and wait times with success rate tracking.
SlowQueriesWidget
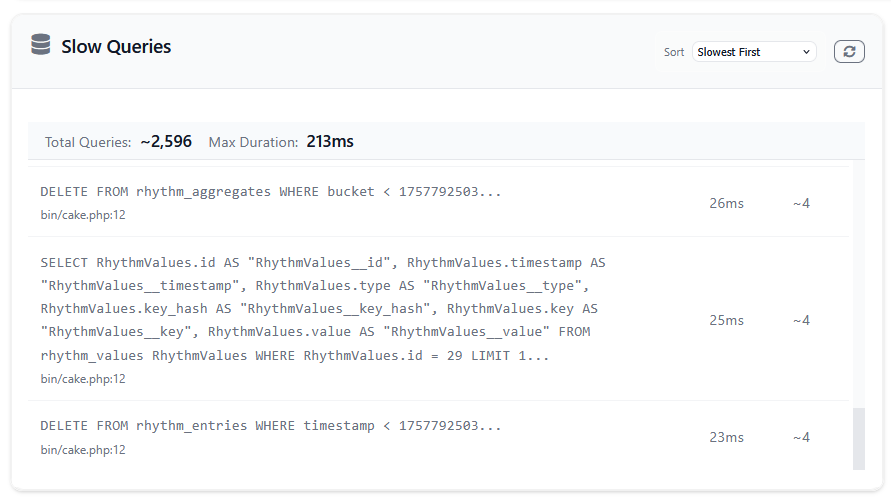
Shows slow database queries with execution times and locations. Shows top 10 slowest queries with sorting options to help find performance issues.
ExceptionsWidget
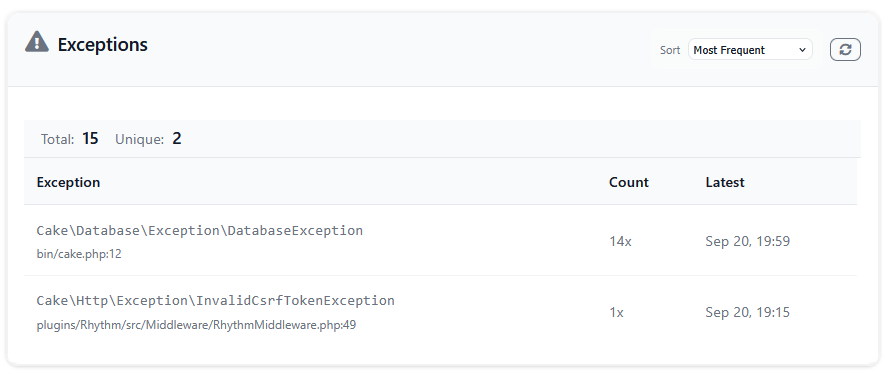
Shows application errors and exceptions. Groups by error type and shows frequency counts with sorting by frequency or latest occurrence.
SlowRequestsWidget
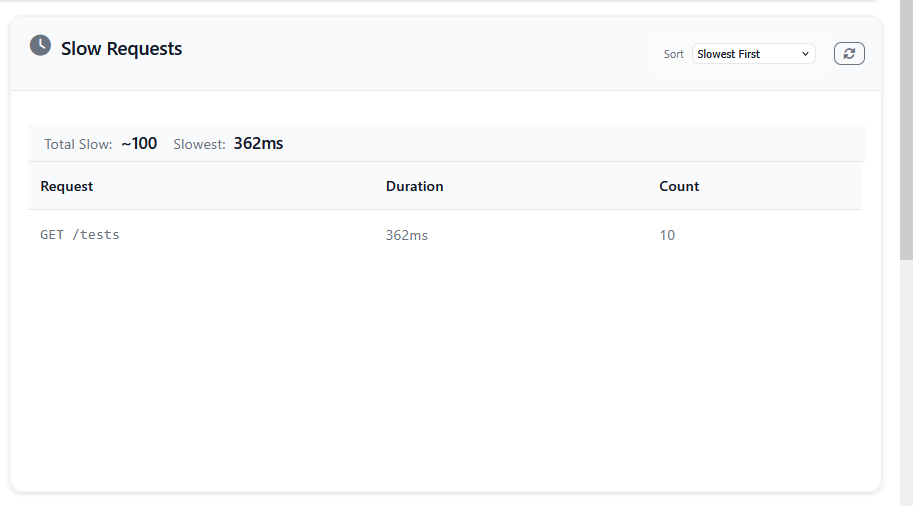
Shows slow HTTP requests with method, path, and response times. Displays top 10 slowest requests with status codes to identify web performance issues.
SlowOutgoingRequestsWidget
Shows external API calls with grouped URLs and response times. Shows slowest external requests to help optimize API usage.
SlowJobsWidget
Shows slow background jobs with execution times and status. Shows top 10 slowest jobs with sorting options for job performance monitoring.
UsageWidget
Displays system resource usage including memory, response times, and request counts. Shows status indicators for each metric.
AppInfoWidget
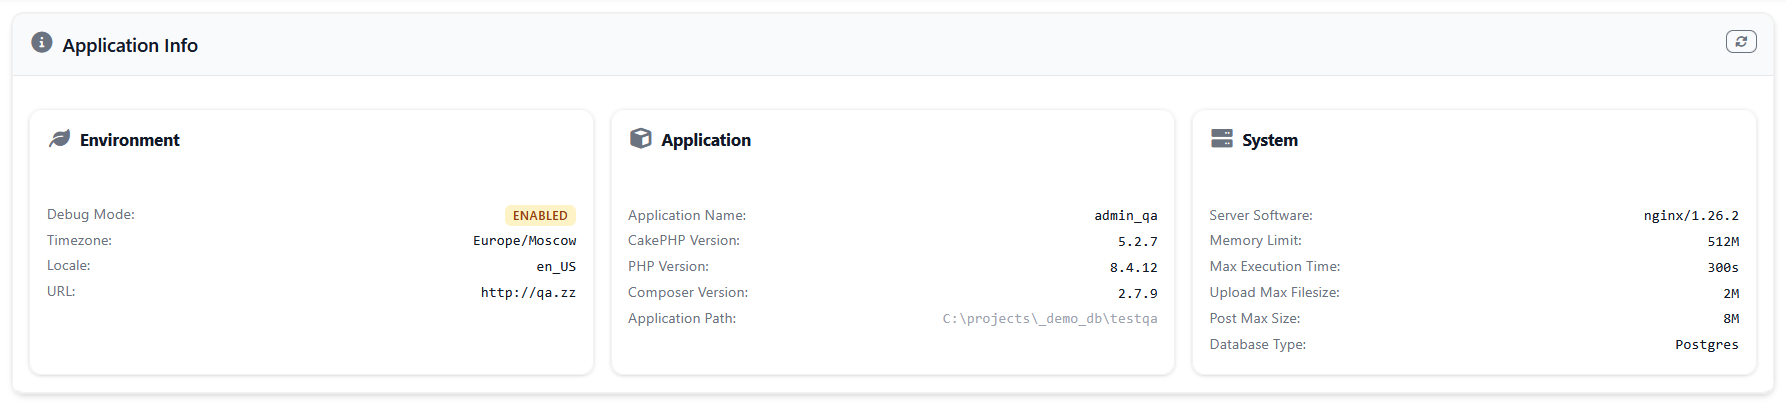
Displays comprehensive application information including CakePHP version, PHP version, debug mode status, system configuration, and database information. Provides a quick overview of your application's environment and configuration with detailed system metrics.
GitWidget
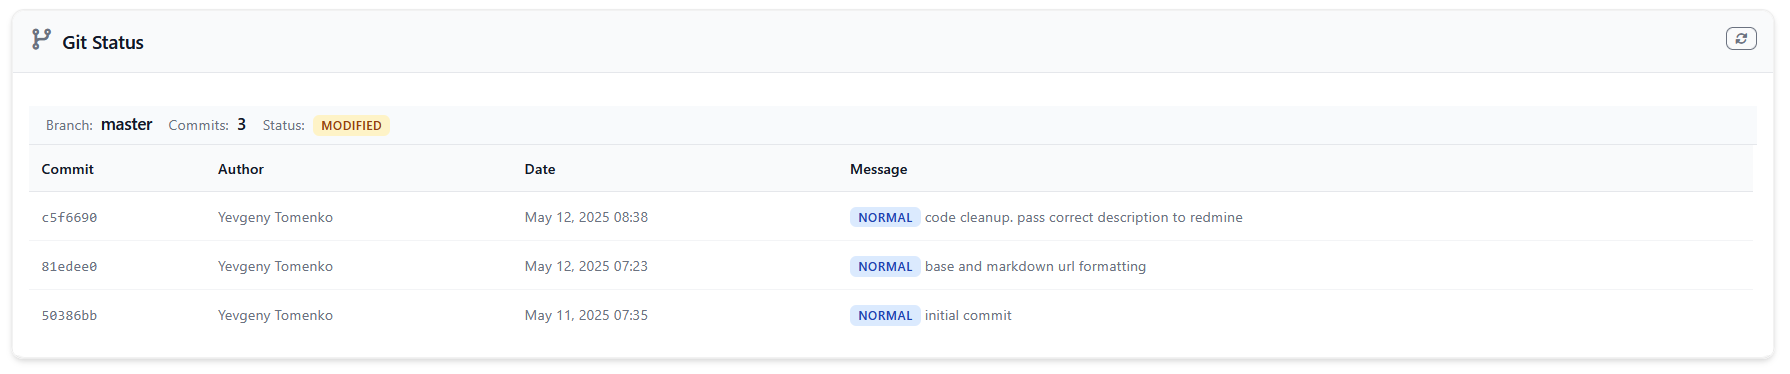
Displays current Git repository information including the active branch, recent commits, and repository status. Helps track deployment status and recent changes with commit classification and metadata.
Command Line Tools
rhythm digest
Process queued metrics into final storage.
rhythm check
Monitor server performance and collect metrics.
rhythm clear
Clear all stored metrics and aggregates.
rhythm purge
Purge specific metric types or all data.
Event System
Rhythm dispatches events for external integrations:
Available Events
Rhythm.metric.recorded- When a metric is recordedRhythm.digest.completed- When metrics are processed to final storageRhythm.server.beat- Server performance snapshot events
Listening to Events
// In a service or component
public function implementedEvents(): array
{
    return [
        'Rhythm.metric.recorded' => 'handleMetricRecorded',
        'Rhythm.digest.completed' => 'handleDigestCompleted',
    ];
}

public function handleMetricRecorded(EventInterface $event): void
{
    $data = $event->getData();
    // Handle metric recording
}

public function handleDigestCompleted(EventInterface $event): void
{
    $data = $event->getData();
    // Handle digest completion
}Database Schema
The plugin creates these main tables:
rhythm_entries
Stores raw metric entries with timestamps and values.
rhythm_aggregates
Stores pre-aggregated metrics for efficient querying and dashboard display.
API Reference
Rhythm Class
record(string $type, string $key, ?int $value = null, ?int $timestamp = null): RhythmEntryset(string $type, string $key, string $value, ?int $timestamp = null): RhythmValueingest(): int- Process queued entriesaggregate(string $type, array|string $aggregates, int $intervalMinutes): CollectionaggregateTotal(string $type, array|string $aggregates, int $intervalMinutes): float|Collectiongraph(string $type, string $aggregate, int $intervalMinutes): Collectionvalues(string $type, ?array $keys = null): Collection- Get values for a typereport(Throwable $exception): $this- Report exceptionstrim(): void- Remove old datapurge(?array $types = null): void- Clear data
Storage Interface
store(CollectionInterface $entries): voidaggregate(string $type, array|string $aggregates, int $intervalMinutes): CollectionInterfacetrim(): void- Remove old datapurge(?array $types = null): void- Clear data
Contributing
- Fork the repository
- Create a feature branch
- Make your changes
- Add tests
- Submit a pull request
License
This plugin is licensed under the MIT License.