Rhythm
Introduction
Rhythm delivers at-a-glance insights into your CakePHP application's performance and usage. With Rhythm, you can track down bottlenecks like slow jobs and endpoints, find your most active users, monitor server resources, and more.
For in-depth debugging of individual events, check out CakePHP Debug Kit.
Installation
WARNING
Rhythm's storage implementation currently requires a MySQL, MariaDB, PostgreSQL, or SQLite database. If you are using a different database engine, you will need a separate database for your Rhythm data.
You may install Rhythm using the Composer package manager:
composer require skie/rhythmNext, you should run the migrate command in order to create the tables needed to store Rhythm's data:
bin/cake migrations migrate -p RhythmOnce Rhythm's database migrations have been run, you may access the Rhythm dashboard via the /rhythm/dashboard route.
NOTE
If you do not want to store Rhythm data in your application's primary database, you may specify a dedicated database connection.
Configuration
Many of Rhythm's configuration options can be controlled using environment variables. To see the available options, register new recorders, or configure advanced options, you may overload the config/rhythm.php configuration file.
Dashboard
The Rhythm dashboard is a collection of widgets that display information about your application's performance and usage. The dashboard is located at /rhythm and is powered by CakePHP's view system.
Customization
The Rhythm dashboard widgets and layout may be configured by customizing the dashboard view. The dashboard view is located at plugins/Rhythm/templates/Dashboard/index.php:
The dashboard is powered by CakePHP's view system and allows you to customize the widgets and layout without needing to rebuild any JavaScript assets.
Within this file, the $this->Rhythm->widget() helper method is responsible for rendering widgets and provides a grid layout. If you would like the dashboard to span the full width of the screen, you may modify the CSS classes:
<div class="dashboard-grid rhythm-grid rhythm-grid-cols-12 rhythm-gap-md" data-dashboard="full-width">
    <?= $this->Rhythm->widget('server-state', ['cols' => ['default' => 12, 'lg' => 12]]) ?>
    <?= $this->Rhythm->widget('slow-queries', ['cols' => ['default' => 12, 'lg' => 6]]) ?>
    <?= $this->Rhythm->widget('slow-requests', ['cols' => ['default' => 12, 'lg' => 6]]) ?>
</div>By default, the dashboard will create a 12 column grid, but you may customize this using the cols configuration:
<?= $this->Rhythm->widget('usage', ['cols' => ['default' => 12, 'lg' => 4]]) ?>Each widget accepts a cols configuration to control the space and positioning:
<?= $this->Rhythm->widget('queues', [
    'cols' => ['default' => 12, 'lg' => 4],
]) ?>Most widgets also accept an expand configuration to show the full widget instead of scrolling:
<?= $this->Rhythm->widget('slow-queries', ['expand' => true]) ?>Widgets
Server State

The server-state widget displays system resource usage for all servers running the rhythm:check command. Please refer to the documentation regarding the servers recorder for more information on system resource reporting.
If you replace a server in your infrastructure, you may wish to stop displaying the inactive server in the Rhythm dashboard after a given duration. You may accomplish this using the ignore-after configuration, which accepts the number of seconds after which inactive servers should be removed from the Rhythm dashboard:
<?= $this->Rhythm->widget('server-state', ['ignore-after' => 10800]) // 3 hours ?>Usage
The usage widget displays the top 10 users making requests to your application, dispatching jobs, and experiencing slow requests.
If you wish to view all usage metrics on screen at the same time, you may include the widget multiple times and specify the type configuration:
<?= $this->Rhythm->widget('usage', ['type' => 'requests']) ?>
<?= $this->Rhythm->widget('usage', ['type' => 'slow_requests']) ?>
<?= $this->Rhythm->widget('usage', ['type' => 'jobs']) ?>To learn how to customize how Rhythm retrieves and displays user information, consult our documentation on resolving users.
NOTE
If your application receives a lot of requests or dispatches a lot of jobs, you may wish to enable sampling. See the user requests recorder, user jobs recorder, and slow jobs recorder documentation for more information.
Exceptions
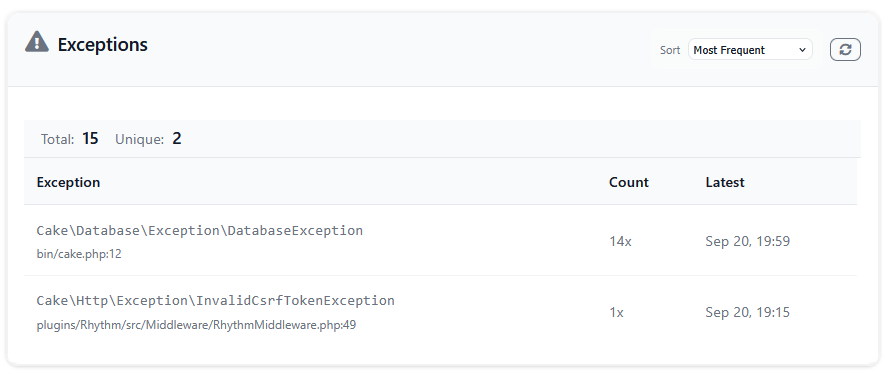
The exceptions widget shows the frequency and recency of exceptions occurring in your application. By default, exceptions are grouped based on the exception class and location where it occurred. See the exceptions recorder documentation for more information.
Queues
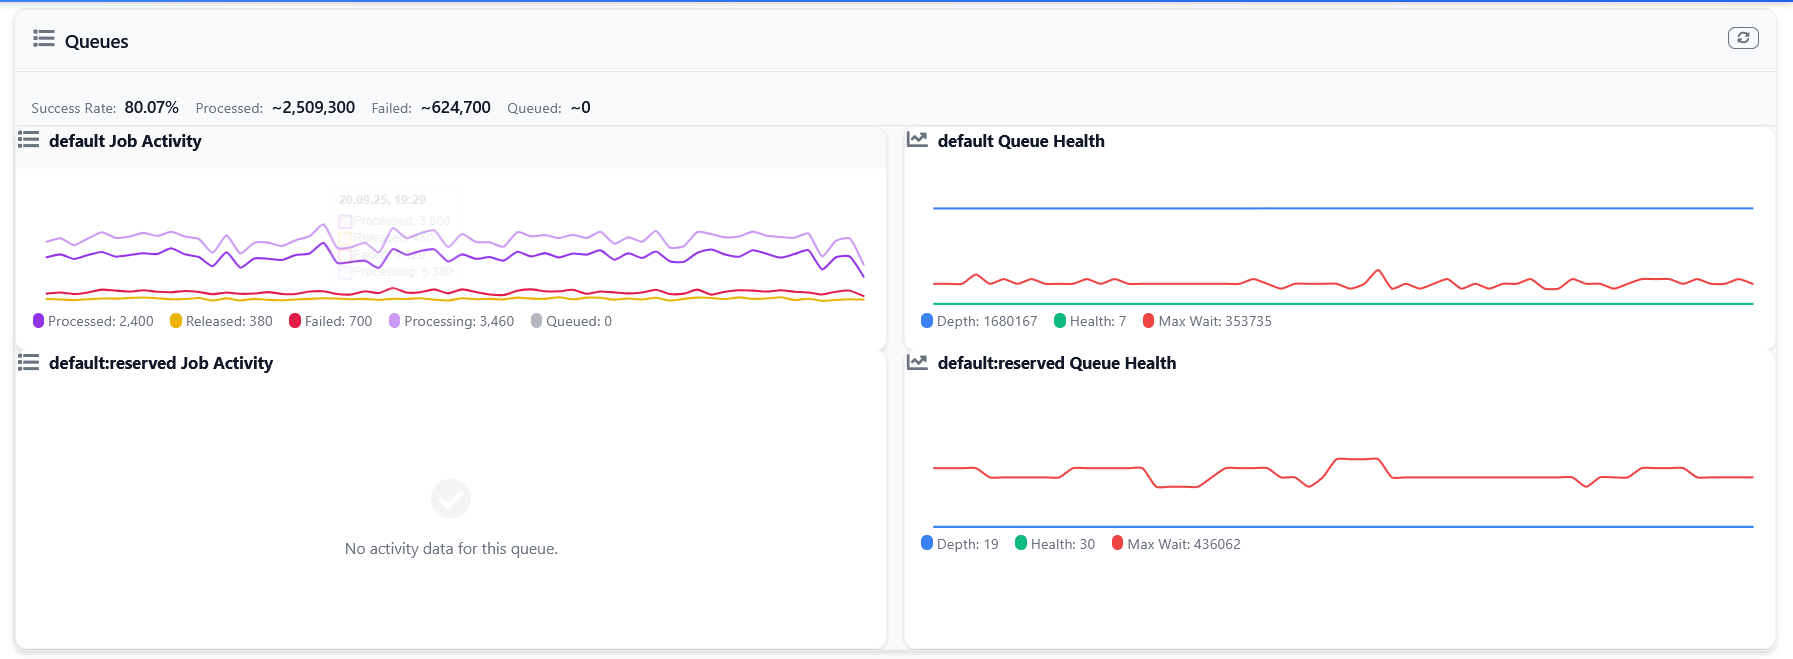
The queues widget shows the throughput of the queues in your application, including the number of jobs queued, processing, processed, released, and failed. See the queues recorder documentation for more information.
Slow Requests
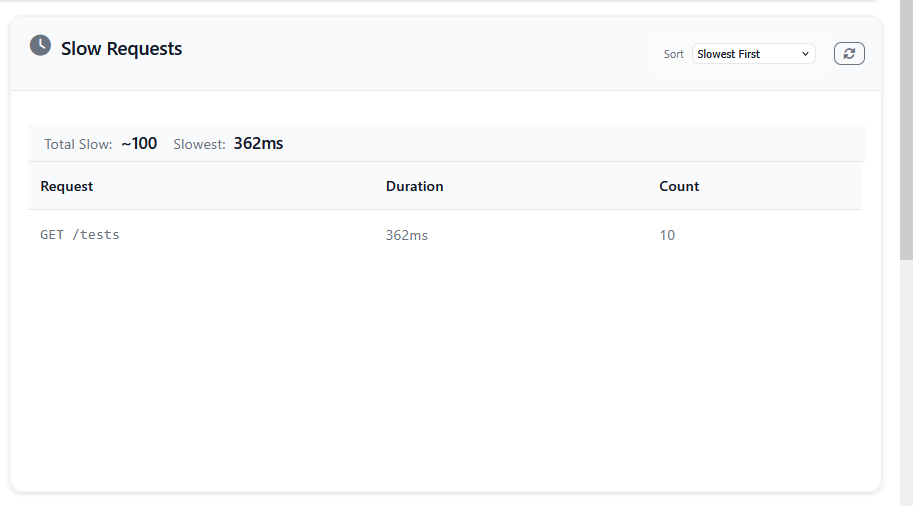
The slow-requests widget shows incoming requests to your application that exceed the configured threshold, which is 10ms by default. See the slow requests recorder documentation for more information.
Slow Jobs
The slow-jobs widget shows the queued jobs in your application that exceed the configured threshold, which is 10ms by default. See the slow jobs recorder documentation for more information.
Slow Queries
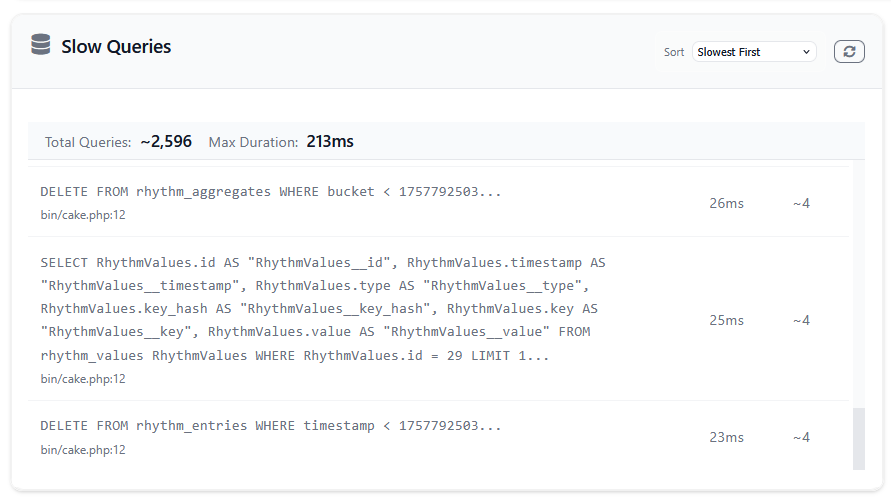
The slow-queries widget shows the database queries in your application that exceed the configured threshold, which is 10ms by default.
By default, slow queries are grouped based on the SQL query (without bindings) and the location where it occurred, but you may choose to not capture the location if you wish to group solely on the SQL query.
If you encounter rendering performance issues due to extremely large SQL queries receiving syntax highlighting, you may disable highlighting by adding the without-highlighting configuration:
<?= $this->Rhythm->widget('slow-queries', ['without-highlighting' => true]) ?>See the slow queries recorder documentation for more information.
Slow Outgoing Requests
The slow-outgoing-requests widget shows outgoing requests made using CakePHP's HTTP client that exceed the configured threshold, which is 1000ms by default.
By default, entries will be grouped by the full URL. However, you may wish to normalize or group similar outgoing requests using regular expressions. See the slow outgoing requests recorder documentation for more information.
App Info
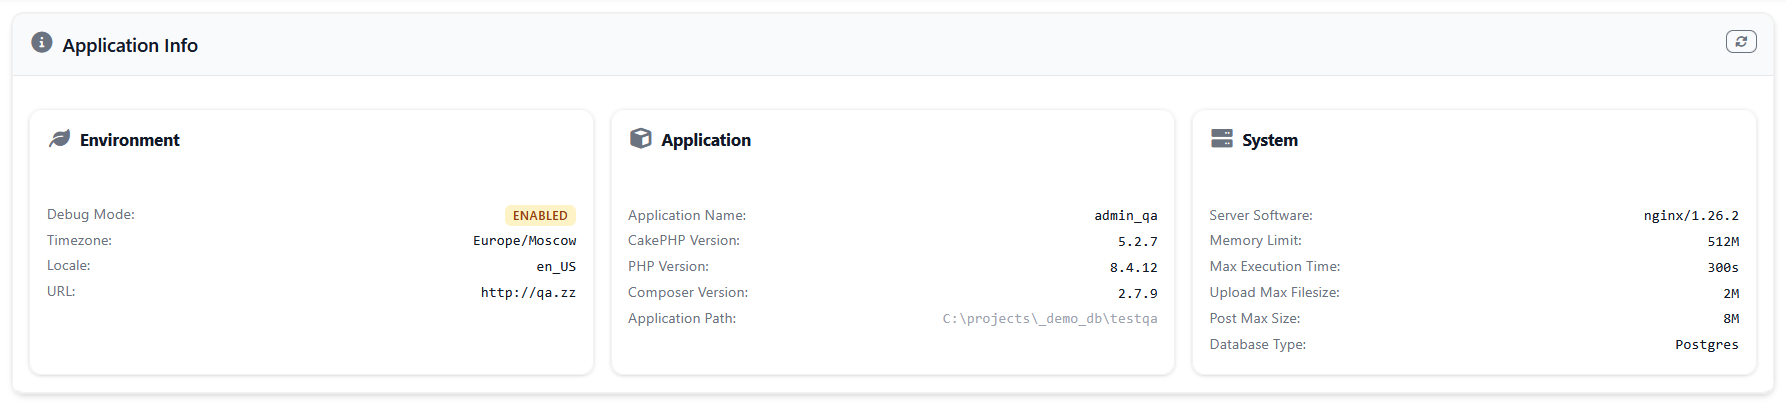
The app-info widget displays comprehensive application information including CakePHP version, PHP version, debug mode status, system configuration, and database information. This widget provides a quick overview of your application's environment and configuration.
The widget shows application name and CakePHP version, PHP version and Composer version, debug mode status and timezone settings, server software and memory limits, database type and connection information, and application URL and file paths.
Git Status
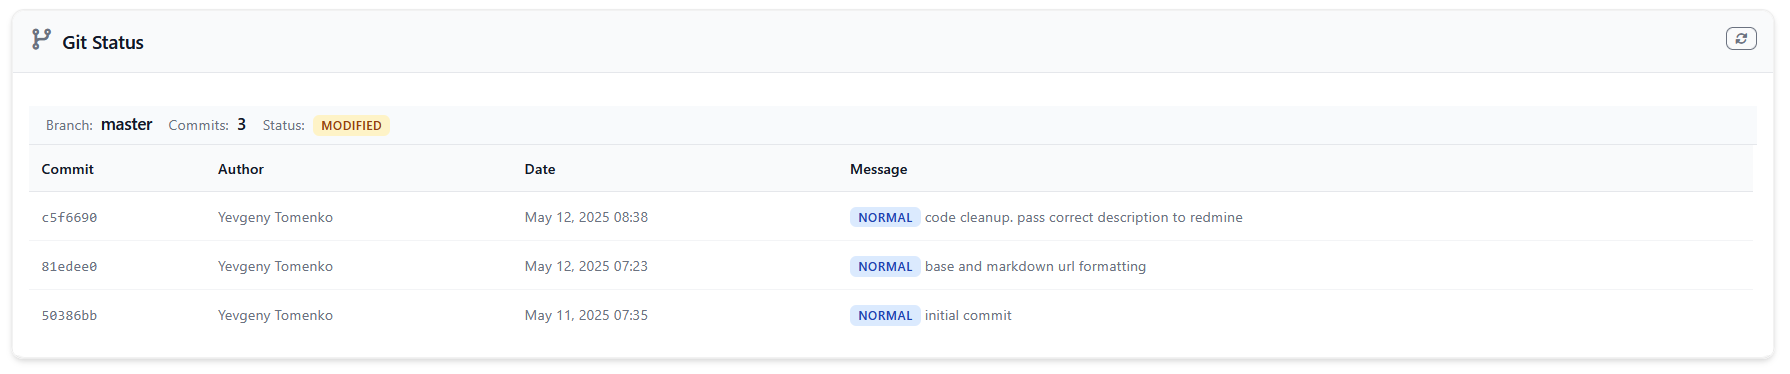
The git-status widget displays current Git repository information including the active branch, recent commits, and repository status. This widget helps track deployment status and recent changes.
The widget shows current Git branch, recent commits with author, date, and message, commit status classification (feature, fix, docs, etc.), repository status (clean, modified, error), ticket numbers and merge information, and commit tags and metadata.
Redis Monitor
The redis_monitor widget shows Redis server statistics including memory usage, key statistics, and network usage. See the redis monitor recorder documentation for more information.
Database Monitor
The database_monitor widget shows database server statistics including connections, threads, and performance metrics. See the mysql monitor recorder and postgresql monitor recorder documentation for more information.
Capturing Entries
Most Rhythm recorders will automatically capture entries based on framework events dispatched by CakePHP. However, the servers recorder and some third-party widgets must poll for information regularly. To use these widgets, you must run the rhythm check daemon on all of your individual application servers:
bin/cake rhythm checkNOTE
To keep the rhythm check process running permanently in the background, you should use a process monitor such as Supervisor or systemd to ensure that the command does not stop running.
As the rhythm check command is a long-lived process, it will not see changes to your codebase without being restarted. You should gracefully restart the command by calling the rhythm restart command during your application's deployment process:
bin/cake rhythm restartNOTE
Rhythm uses the cache to store restart signals, so you should verify that a cache driver is properly configured for your application before using this feature.
Recorders
Recorders are responsible for capturing entries from your application to be recorded in the Rhythm database. Recorders are registered and configured in the recorders section of the Rhythm configuration file.
Exceptions
The Exceptions recorder captures information about reportable exceptions occurring in your application for display on the Exceptions widget.
You may optionally adjust the sample rate and ignored exceptions patterns. You may also configure whether to capture the location that the exception originated from. The captured location will be displayed on the Rhythm dashboard which can help to track down the exception origin; however, if the same exception occurs in multiple locations then it will appear multiple times for each unique location.
Queues
The Queues recorder captures information about your applications queues for display on the Queues widget.
You may optionally adjust the sample rate and ignored jobs patterns.
Slow Jobs
The SlowJobs recorder captures information about slow jobs occurring in your application for display on the Slow Jobs widget.
You may optionally adjust the slow job threshold, sample rate, and ignored job patterns.
You may have some jobs that you expect to take longer than others. In those cases, you may configure per-job thresholds:
'slow_jobs' => [
    // ...
    'threshold' => [
        '#^App\\Jobs\\GenerateYearlyReports$#' => 5000,
        'default' => env('RHYTHM_SLOW_JOBS_THRESHOLD', 10),
    ],
],If no regular expression patterns match the job's classname, then the 'default' value will be used.
Slow Outgoing Requests
The SlowOutgoingRequests recorder captures information about outgoing HTTP requests made using CakePHP's HTTP client that exceed the configured threshold for display on the Slow Outgoing Requests widget.
You may optionally adjust the slow outgoing request threshold, sample rate, and ignored URL patterns.
You may have some outgoing requests that you expect to take longer than others. In those cases, you may configure per-request thresholds:
'slow_outgoing_requests' => [
    // ...
    'threshold' => [
        '#backup.zip$#' => 5000,
        'default' => env('RHYTHM_SLOW_OUTGOING_REQUESTS_THRESHOLD', 1000),
    ],
],If no regular expression patterns match the request's URL, then the 'default' value will be used.
You may also configure URL grouping so that similar URLs are grouped as a single entry. For example, you may wish to remove unique IDs from URL paths or group by domain only. Groups are configured using a regular expression to "find and replace" parts of the URL. Some examples are included in the configuration file:
'slow_outgoing_requests' => [
    // ...
    'groups' => [
        // '#^https://api\.github\.com/repos/.*$#' => 'api.github.com/repos/*',
        // '#^https?://([^/]*).*$#' => '\1',
        // '#/\d+#' => '/*',
    ],
],The first pattern that matches will be used. If no patterns match, then the URL will be captured as-is.
Slow Queries
The SlowQueries recorder captures any database queries in your application that exceed the configured threshold for display on the Slow Queries widget.
You may optionally adjust the slow query threshold, sample rate, and ignored query patterns. You may also configure whether to capture the query location. The captured location will be displayed on the Rhythm dashboard which can help to track down the query origin; however, if the same query is made in multiple locations then it will appear multiple times for each unique location.
You may have some queries that you expect to take longer than others. In those cases, you may configure per-query thresholds:
'slow_queries' => [
    // ...
    'threshold' => [
        '#^insert into `yearly_reports`#' => 5000,
        'default' => env('RHYTHM_SLOW_QUERIES_THRESHOLD', 10),
    ],
],If no regular expression patterns match the query's SQL, then the 'default' value will be used.
Slow Requests
The SlowRequests recorder captures information about requests made to your application for display on the Slow Requests and Usage widgets.
You may optionally adjust the slow route threshold, sample rate, and ignored paths.
You may have some requests that you expect to take longer than others. In those cases, you may configure per-request thresholds:
'slow_requests' => [
    // ...
    'threshold' => [
        '#^/admin/#' => 5000,
        'default' => env('RHYTHM_SLOW_REQUESTS_THRESHOLD', 10),
    ],
],If no regular expression patterns match the request's URL, then the 'default' value will be used.
Servers
The Servers recorder captures CPU, memory, and storage usage of the servers that power your application for display on the Server State widget. This recorder requires the rhythm:check command to be running on each of the servers you wish to monitor.
Each reporting server must have a unique name. By default, Rhythm will use the value returned by PHP's gethostname function. If you wish to customize this, you may set the RHYTHM_SERVER_NAME environment variable:
RHYTHM_SERVER_NAME=load-balancerThe Rhythm configuration file also allows you to customize the directories that are monitored.
User Jobs
The UserJobs recorder captures information about the users dispatching jobs in your application for display on the Usage widget.
You may optionally adjust the sample rate and ignored job patterns.
User Requests
The UserRequests recorder captures information about the users making requests to your application for display on the Usage widget.
You may optionally adjust the sample rate and ignored URL patterns.
Redis Monitor
The RedisMonitor recorder captures Redis server statistics including memory usage, key statistics, and network usage for display on the Redis Monitor widget.
You may configure the monitoring interval, Redis connections, and which metrics to capture:
'redis_monitor' => [
    'enabled' => env('RHYTHM_REDIS_MONITOR_ENABLED', true),
    'interval' => env('RHYTHM_REDIS_MONITOR_INTERVAL', 5), // minutes
    'connections' => ['default_db0'],
    'metrics' => [
        'memory_usage' => env('RHYTHM_REDIS_MEMORY_ENABLED', true),
        'key_statistics' => env('RHYTHM_REDIS_KEYS_ENABLED', true),
        'removed_keys' => env('RHYTHM_REDIS_REMOVED_ENABLED', true),
        'network_usage' => env('RHYTHM_REDIS_NETWORK_ENABLED', true),
    ],
],MySQL Monitor
The MySqlMonitor recorder captures MySQL server statistics including connections, threads, InnoDB metrics, and performance metrics for display on the Database Monitor widget.
You may configure the monitoring interval, database connections, and which metrics to capture:
'mysql_monitor' => [
    'enabled' => env('RHYTHM_MYSQL_MONITOR_ENABLED', true),
    'interval' => env('RHYTHM_MYSQL_MONITOR_INTERVAL', 5), // minutes
    'connections' => ['default'],
    'metrics' => [
        'connections' => env('RHYTHM_MYSQL_CONNECTIONS_ENABLED', true),
        'threads' => env('RHYTHM_MYSQL_THREADS_ENABLED', true),
        'innodb' => env('RHYTHM_MYSQL_INNODB_ENABLED', true),
        'performance' => env('RHYTHM_MYSQL_PERFORMANCE_ENABLED', true),
    ],
],PostgreSQL Monitor
The PostgreSqlMonitor recorder captures PostgreSQL server statistics including connections, transactions, and performance metrics for display on the Database Monitor widget.
You may configure the monitoring interval, database connections, and which metrics to capture:
'postgresql_monitor' => [
    'enabled' => env('RHYTHM_POSTGRESQL_MONITOR_ENABLED', true),
    'interval' => env('RHYTHM_POSTGRESQL_MONITOR_INTERVAL', 5), // minutes
    'connections' => ['default'],
    'metrics' => [
        'connections' => env('RHYTHM_POSTGRESQL_CONNECTIONS_ENABLED', true),
        'transactions' => env('RHYTHM_POSTGRESQL_TRANSACTIONS_ENABLED', true),
        'performance' => env('RHYTHM_POSTGRESQL_PERFORMANCE_ENABLED', true),
        'background_writer' => env('RHYTHM_POSTGRESQL_BACKGROUND_WRITER_ENABLED', true),
    ],
],Git
The Git recorder captures Git repository information including current branch, recent commits, and repository status for display on the Git Status widget.
The recorder automatically detects Git repositories by searching the current directory and parent directories. It captures current branch name, recent commits with metadata (author, date, message), commit classification (feature, fix, docs, test, etc.), repository status (clean, modified, error), ticket numbers and merge information, and commit tags and version information.
The recorder uses throttling to prevent excessive Git operations and runs every 60 seconds by default. It requires Git to be available in the system PATH and will gracefully handle cases where Git is not available or the directory is not a Git repository.
Filtering
As we have seen, many recorders offer the ability to, via configuration, "ignore" incoming entries based on their value, such as a request's URL. But, sometimes it may be useful to filter out records based on other factors, such as the currently authenticated user. To filter out these records, you may pass a closure to Rhythm's filter method. Typically, the filter method should be invoked within the bootstrap method of your application's Application.php:
use Cake\Core\Configure;
use Rhythm\Rhythm;

/**
 * Bootstrap the application.
 */
public function bootstrap(): void
{
    parent::bootstrap();

    $rhythm = $this->getContainer()->get(Rhythm::class);

    $rhythm->filter(function ($entry) {
        return $this->getRequest()->getAttribute('identity')->get('isAdmin');
    });
}Performance
Rhythm has been designed to drop into an existing application without requiring any additional infrastructure. However, for high-traffic applications, there are several ways of removing any impact Rhythm may have on your application's performance.
Using a Different Database
For high-traffic applications, you may prefer to use a dedicated database connection for Rhythm to avoid impacting your application database.
You may customize the database connection used by Rhythm by setting the RHYTHM_DB_CONNECTION environment variable.
RHYTHM_DB_CONNECTION=rhythmRedis Ingest
WARNING
The Redis Ingest requires Redis 6.2 or greater and phpredis or predis as the application's configured Redis client driver.
By default, Rhythm will store entries directly to the configured database connection after the HTTP response has been sent to the client or a job has been processed; however, you may use Rhythm's Redis ingest driver to send entries to a Redis stream instead. This can be enabled by configuring the RHYTHM_INGEST_DRIVER environment variable:
RHYTHM_INGEST_DRIVER=redisRhythm will use your default Redis connection by default, but you may customize this via the RHYTHM_REDIS_CONNECTION environment variable:
RHYTHM_REDIS_CONNECTION=rhythmWhen using the Redis ingest, you will need to run the rhythm:digest command to monitor the stream and move entries from Redis into Rhythm's database tables.
bin/cake rhythm digestNOTE
To keep the rhythm digest process running permanently in the background, you should use a process monitor such as Supervisor to ensure that the Rhythm worker does not stop running.
As the rhythm digest command is a long-lived process, it will not see changes to your codebase without being restarted. You should gracefully restart the command by calling the rhythm restart command during your application's deployment process:
bin/cake rhythm restartNOTE
Rhythm uses the cache to store restart signals, so you should verify that a cache driver is properly configured for your application before using this feature.
Sampling
By default, Rhythm will capture every relevant event that occurs in your application. For high-traffic applications, this can result in needing to aggregate millions of database rows in the dashboard, especially for longer time periods.
You may instead choose to enable "sampling" on certain Rhythm data recorders. For example, setting the sample rate to 0.1 on the User Requests recorder will mean that you only record approximately 10% of the requests to your application. In the dashboard, the values will be scaled up and prefixed with a ~ to indicate that they are an approximation.
In general, the more entries you have for a particular metric, the lower you can safely set the sample rate without sacrificing too much accuracy.
Trimming
Rhythm will automatically trim its stored entries once they are outside of the dashboard window. Trimming occurs when ingesting data using a lottery system which may be customized in the Rhythm configuration file.
Custom Widgets
Rhythm allows you to build custom widgets to display data relevant to your application's specific needs. Rhythm uses CakePHP's view system, so you may want to review its documentation before building your first custom widget.
Widget Components
Creating a custom widget in Rhythm starts with extending the base BaseWidget class and defining a corresponding template:
namespace App\Widget;

use Rhythm\Widget\BaseWidget;

class TopSellers extends BaseWidget
{
    public function getData(array $options = []): array
    {
        // Fetch and return widget data
        return [
            'sellers' => $this->getTopSellers(),
            'total_sales' => $this->getTotalSales(),
        ];
    }

    public function getTemplate(): string
    {
        return 'Widget/top_sellers';
    }

    public function getRefreshInterval(): int
    {
        return 30; // seconds
    }

    protected function getTopSellers(): array
    {
        // Implementation to fetch top sellers data
        return [];
    }

    protected function getTotalSales(): int
    {
        // Implementation to fetch total sales
        return 0;
    }
}When writing your Rhythm widget's corresponding template, you may leverage Rhythm's helper methods for a consistent look and feel:
<?php
/**
 * Top Sellers Widget Template
 *
 * @var \App\View\AppView $this
 * @var array $data Widget data
 */
?>

<?= $this->Rhythm->cardHeader('Top Sellers') ?>

<?= $this->Rhythm->scroll($this->element('Widget/top_sellers_content', $data)) ?>The widget template should be placed in templates/element/Widget/top_sellers.php and can use Rhythm's helper methods for consistent styling.
Once you have defined your widget class and template, the widget may be included in your dashboard view:
<?= $this->Rhythm->widget('top-sellers', ['cols' => ['default' => 12, 'lg' => 4]]) ?>NOTE
If your widget is included in a plugin, you will need to register the widget with the Rhythm widget registry.
Widget Styling
If your widget requires additional styling beyond the classes and components included with Rhythm, there are a few options for including custom CSS for your widgets.
CSS Files
For widgets contained within a plugin, you may instruct Rhythm to load additional stylesheets by defining a getCss method on your widget class that returns the file paths to your CSS files:
class TopSellers extends BaseWidget
{
    // ...

    public static function getCss(): array
    {
        return [
            'plugins/YourPlugin/webroot/css/top-sellers.css',
        ];
    }
}When this widget is included on the dashboard, Rhythm will automatically include the contents of these files within <style> tags so they do not need to be published to the webroot directory.
Data Capture and Aggregation
Custom widgets may fetch and display data from anywhere; however, you may wish to leverage Rhythm's powerful and efficient data recording and aggregation system.
Capturing Entries
Rhythm allows you to record "entries" using the Rhythm::record method:
use Rhythm\Rhythm;

$rhythm = $this->getContainer()->get(Rhythm::class);

$rhythm->record('user_sale', $user->id, $sale->amount)
    ->sum()
->count();The first argument provided to the record method is the type for the entry you are recording, while the second argument is the key that determines how the aggregated data should be grouped. For most aggregation methods you will also need to specify a value to be aggregated. In the example above, the value being aggregated is $sale->amount. You may then invoke one or more aggregation methods (such as sum) so that Rhythm may capture pre-aggregated values into "buckets" for efficient retrieval later.
The available aggregation methods are:
avgcountmaxminsum
Retrieving Aggregate Data
When extending Rhythm's BaseWidget class, you may use the aggregate method to retrieve aggregated data for the period being viewed in the dashboard:
class TopSellers extends BaseWidget
{
    public function getData(array $options = []): array
    {
        return [
            'topSellers' => $this->rhythm->aggregate('user_sale', ['sum', 'count'], 60)
        ];
    }
}The aggregate method returns a collection of PHP stdClass objects. Each object will contain the key property captured earlier, along with keys for each of the requested aggregates:
<?php foreach ($topSellers as $seller): ?>
    <?= $seller->key ?>
    <?= $seller->sum ?>
    <?= $seller->count ?>
<?php endforeach; ?>Rhythm will primarily retrieve data from the pre-aggregated buckets; therefore, the specified aggregates must have been captured up-front using the Rhythm::record method. The oldest bucket will typically fall partially outside the period, so Rhythm will aggregate the oldest entries to fill the gap and give an accurate value for the entire period, without needing to aggregate the entire period on each poll request.
You may also retrieve a total value for a given type by using the aggregateTotal method. For example, the following method would retrieve the total of all user sales instead of grouping them by user.
$total = $this->rhythm->aggregateTotal('user_sale', 'sum');Custom Recorders
Plugin authors may wish to provide recorder classes to allow users to configure the capturing of data.
Recorders are registered in the recorders section of the application's config/rhythm.php configuration file:
[
    // ...
    'recorders' => [
        'Acme\Recorders\Deployments' => [
            // ...
        ],

        // ...
    ],
]Recorders may listen to events by implementing the EventListenerInterface and specifying a $listens property. Rhythm will automatically register the listeners and call the recorders record method:
<?php

namespace Acme\Recorders;

use Cake\Event\EventListenerInterface;
use Cake\Event\EventInterface;
use Rhythm\Rhythm;

class Deployments implements EventListenerInterface
{
    /**
     * The events to listen for.
     *
     * @var array<int, string>
     */
    public array $listens = [
        'Acme.Deployment.completed',
    ];

    /**
     * Record the deployment.
     */
    public function record(EventInterface $event): void
    {
        $rhythm = $event->getSubject()->getContainer()->get(Rhythm::class);

        $rhythm->record(
            'deployment',
            $event->getData('environment'),
            $event->getData('duration')
        )->count();
    }

    /**
     * Implemented events.
     *
     * @return array<string, mixed>
     */
    public function implementedEvents(): array
    {
        return [
            'Acme.Deployment.completed' => 'record',
        ];
    }
}